
Sales, subscriptions and products
Read the Sales, Subscriptions and Products tabs: orders, total sales and how they add up, recurring revenue, renewals, and how each product sells.
Three tabs of Dashboard & Analytics are about money coming in. Sales shows what your store sold and how the total adds up, Subscriptions shows your recurring revenue, and Products shows how each product is doing.
Open the tabs
- In your site dashboard, click Dashboard & Analytics.
- Click Sales, Subscriptions or Products in the row of tabs.
- Choose a period with the buttons under the tabs: Last 7 days, Last 30 days (the default), Last 90 days, Month to date, Year to date or Custom. Days follow your computer's time zone.
All three tabs follow the Test data switch in the top bar: while it is on, they show only orders placed in test mode. See Test data and live data.
The Sales tab
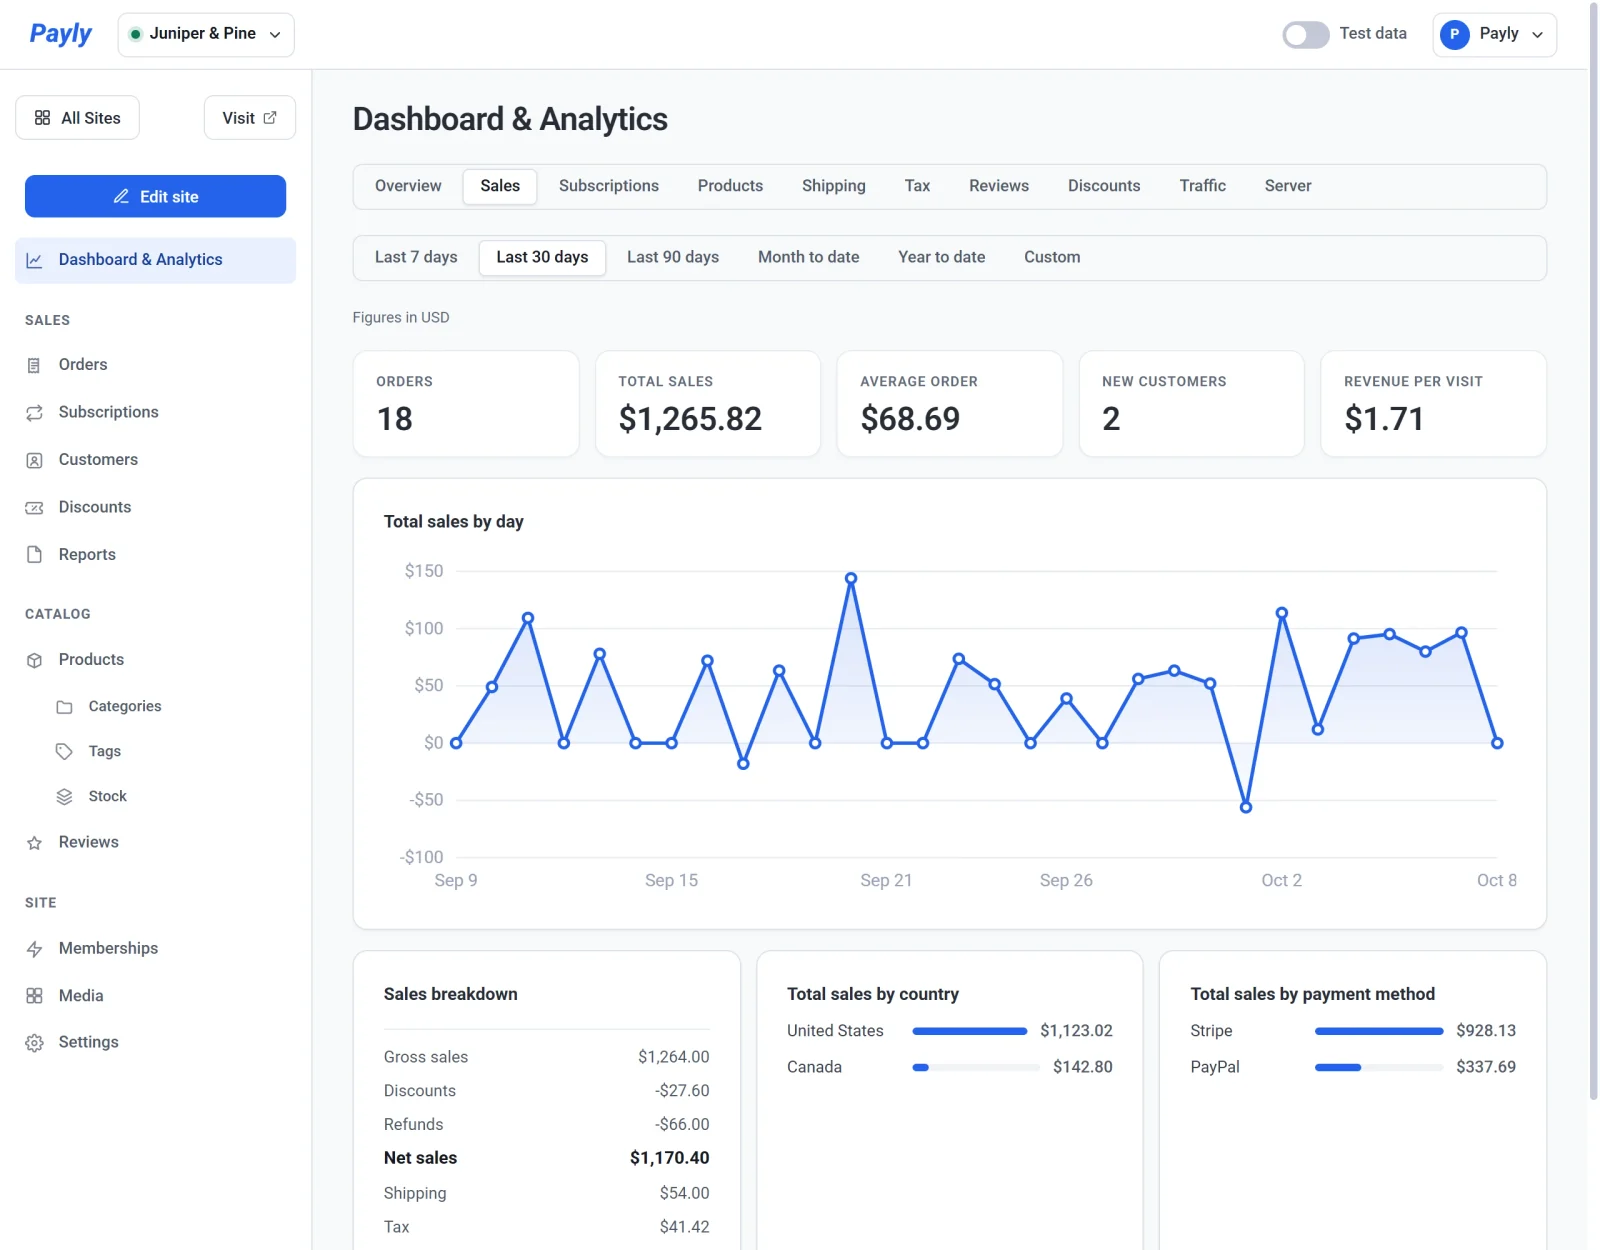
| Figure | What it shows |
|---|---|
| Orders | The number of payments in the period, subscription renewals included. Each counts on the day it was paid. |
| Total sales | What buyers paid, including shipping and tax, minus the refunds you made during the period. |
| Average order | The products' total after discounts, before tax, shipping and refunds, divided by the number of orders. |
| New customers | Customers who created an account during the period and also paid for an order in it. |
| Revenue per visit | Total sales divided by the number of visits to your store in the period. |
Total sales by day plots each day of the period. A refund counts on the day you make it, not on the day of the order, so a day when you refunded more than you sold goes below zero, and earlier periods never change after the fact.
The sales breakdown
The cards under the chart show how your total adds up and where it came from.
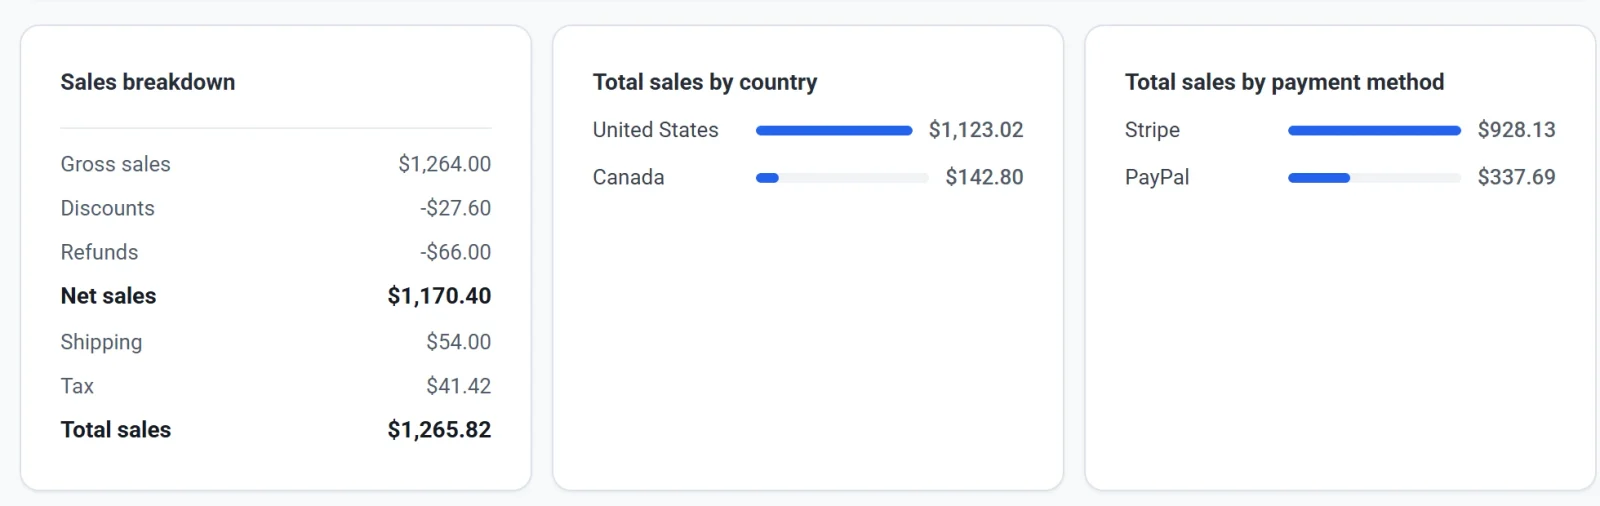
Sales breakdown works like a receipt for the whole period: Gross sales + Discounts + Refunds = Net sales, and Net sales + Shipping + Tax = Total sales.
| Line | What it holds |
|---|---|
| Gross sales | What your products sold for before discounts, sign-up fees included. |
| Discounts | What discounts took off, as a negative amount. |
| Refunds | Money you refunded, without its shipping and tax, as a negative amount. |
| Net sales | Gross sales after discounts and refunds. |
| Shipping | Shipping charged, less shipping refunded. |
| Tax | Tax charged, less tax refunded. |
| Total sales | What buyers paid, less what you refunded. |
Total sales by country groups the total by where each order went, and Total sales by payment method by how it was paid: PayPal, Stripe, Manual (orders you added yourself) or Free (orders that cost nothing).
The Subscriptions tab
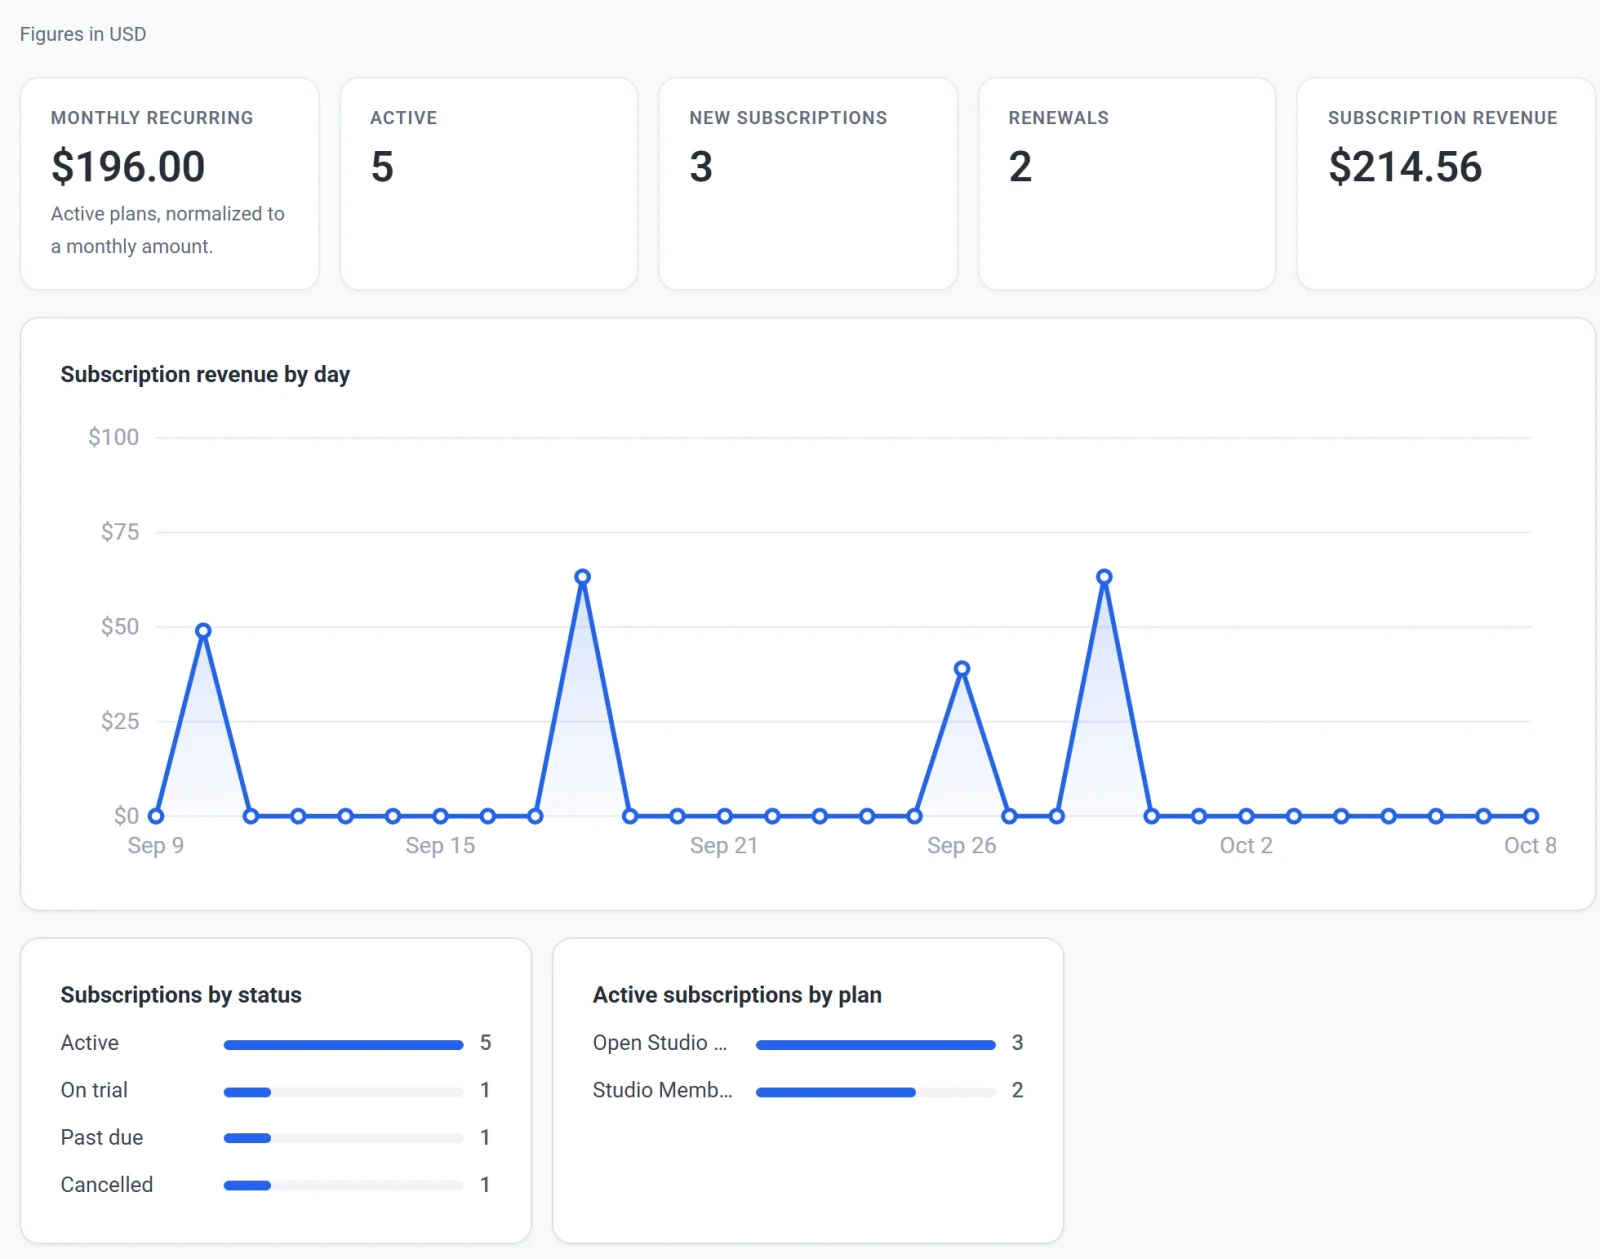
| Figure | What it shows |
|---|---|
| Monthly recurring | Your active plans added up as a monthly amount. A yearly plan counts as a twelfth of its price. Plans on a free trial or paused do not count. |
| Active | The subscriptions that are active now, trials included. |
| New subscriptions | The subscriptions that started during the period. |
| Renewals | The renewal payments made during the period. A subscription's first payment is not a renewal. |
| Subscription revenue | What subscription payments brought in during the period, first payments and renewals, minus the refunds you made on them. |
Monthly recurring, Active and the two cards describe your store as it is now, so the period does not change them. Subscriptions by status counts the subscriptions that are active, on trial, past due, paused and cancelled, and Active subscriptions by plan counts the active ones for each product. To work with the subscriptions themselves, see View and manage subscriptions.
The Products tab
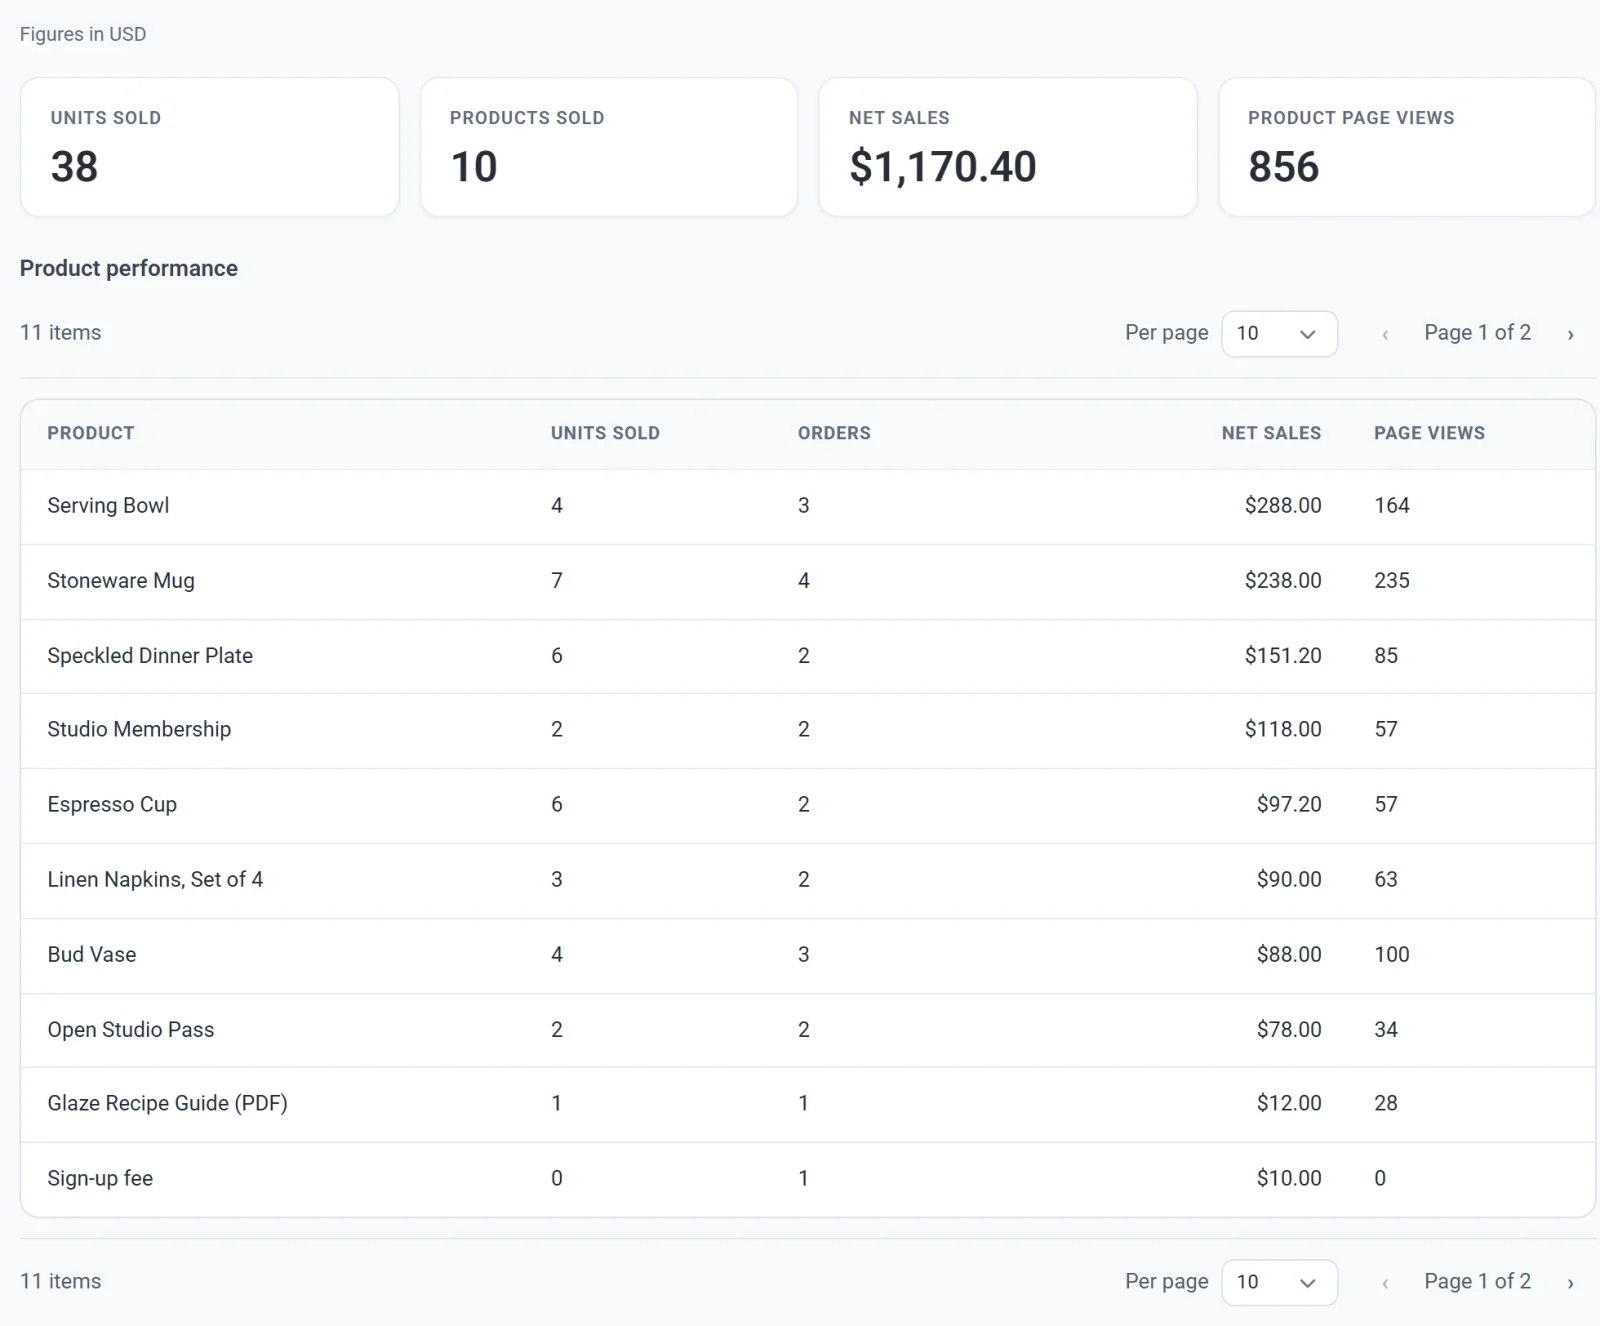
- Units sold is how many items were bought. A refund by amount does not take units back.
- Products sold is how many different products sold at least one unit.
- Net sales is gross sales after discounts and refunds, the same figure as in the sales breakdown.
- Product page views is how many times your product pages were opened.
The Product performance table has a row for each product, with its Units sold, Orders, Net sales and Page views. A product with options, such as sizes or colors, has one row. Products that people viewed but did not buy are listed too, so you can see what gets attention without selling. The table starts with the product that earned the most.
When an order holds several products, its discounts and refunds are shared among them by what each one cost. The table shows 10 products at a time: use the arrows to move through it, or choose how many to show in Per page.
More than one currency
A line under the period buttons says which currency the figures are in, for example Figures in USD. If your store took payments in more than one currency during the period, a Currency list appears in its place. Choose a currency to see its figures.
Download the figures
To get sales figures as a spreadsheet file, grouped by day, product, country or payment method, use Reports in the Sales group of the menu. See Download sales, tax and shipping reports.